

Semestrial Letter (H1 2026)

Dear investors,
IRIVEST Investment Managers was born in August 2025 from the merger between Chahine Capital and DYNASTY Asset Management, with a clear ambition: to consolidate our resources while preserving the integrity of the expertise that makes them unique. This merger was built around a simple principle: to retain the DNA, teams, investment philosophies, and investment processes in order to ensure the continuity our clients expect.
In this context, our offering remains structured around complementary and transparent investment solutions: convertible bond and credit investment within the DYNASTY SICAV, and quantitative momentum equity investment through our Chahine Funds SICAV.
This dynamic is also reflected in our brand change, designed to better harmonize and clarify our range of Equity funds: the “Digital Funds” SICAV became “Chahine Funds” last January where its sub-funds have been renamed (Chahine Funds – Equity Europe, Equity Continental Europe, Equity Europe Smaller Companies, Equity Eurozone and Equity US).
This is solely a name change: the investment objectives and characteristics of the funds remain unchanged.
Investments in equities are subject to the risk of capital loss and fluctuations in financial markets. Chahine Funds' investment strategies rely in part on quantitative models, momentum signals and artificial intelligence-based analysis, which may prove ineffective or generate false signals under certain market conditions. Exposure to small and mid-cap companies and foreign currencies may increase volatility. Past performance and outperformance are not indicative of future results.
Chahine Funds Equity:
The first half of the year unfolded in two distinct phases for the equity markets. Following a mixed first quarter across different market segments – characterised in particular by the strong outperformance of metals and mining stocks up until the end of February – the second quarter was very buoyant and characterised by an upward trend. This acceleration, however, took place against a backdrop of a reversal in macroeconomic momentum, which had become less favourable in Europe. Despite this change in the economic landscape, equity markets continued to rise and ended the half-year with solid performances, with the MSCI Europe NR up +10.7% and the MSCI USA NR up +9.9%.
Against this backdrop, our European equity strategies were able to capitalise on the trends that emerged, and our model successfully identified the signs of overheating and reversal that occurred during the half-year. For our US equity strategy, it was, unsurprisingly, the overwhelmingly dominant theme of AI that drove the market.
Focus on Chahine Funds Equity Europe
Chahine Funds Equity Europe has had an excellent first half of 2026, with a cumulative return of +18.5% at the end of June (Acc share class, in EUR), compared with +10.7% for the MSCI Europe NR. This outperformance reflects the positive impact of stock selection and the inferred asset allocation, as well as the model’s ability to adapt the portfolio’s composition to changes in the economic cycle and market conditions.

Past performance is not a reliable indicator of future performance. Source: IRIVEST IM, FactSet, Data as of 30/06/26. Share class Acc in EUR. Net of fees.
The first two months of the year saw a continuation of the positive trends observed at the end of 2025. Over this period, the fund significantly outperformed its benchmark (+10.5% versus +7.3%), buoyed by its exposure to industrial stocks, particularly in defence, construction and electrical equipment. The ongoing rally in metals and mining stocks also made a positive contribution to performance. Underweight positions in consumer discretionary and healthcare provided relative support, whilst positions in financials proved less favourable.
March marked a turning point, with a sharp market correction against a backdrop of geopolitical tensions in the Middle East. The fund fell by -8.1%, slightly more than the MSCI Europe NR (-7.7%), but maintained a lead since the start of the year (+1.6% compared with -0.9% for the index). The smoothing mechanism triggered by the model enabled the fund to lock in some gains, reduce active risk and mitigate the impact of market volatility. The financial and industrial sectors are providing some resilience, whilst the fund’s low exposure to major oil companies is holding it back in an environment then favourable to the energy sector. The fund’s overweight position in metals and mining is not working in its favour, despite the mitigating effect of portfolio adjustments.
The market rebound between April and June enabled the fund to significantly extend its lead. In April, the recovery in cyclical stocks provided strong support for performance (+9.0% compared with +5.2% for the MSCI Europe NR), driven in particular by the IT and industrial sectors, as well as exposure to small and mid-caps. However, economic momentum indicators signalled the start of a contracyclical phase, leading the model to reduce exposure to the most cyclical segments, particularly small and mid-caps. In May, however, small and mid-caps continued to make a positive contribution, with remarkable performances in the industrials, consumer discretionary and financial sectors. In June, the new portfolio construction proved its effectiveness by shielding the fund from the sharp underperformance of small and mid-caps, enabling it to preserve around 3% in relative performance over the month alone.
Over the half-year as a whole, the strategy confirmed its ability to combine stock selection, sector allocation and adaptability to market environment. Adapting the portfolio to changes in market conditions – notably through the smoothing mechanism and the shift to a contracyclical strategy – enabled the fund to generate significant outperformance whilst maintaining control over active risk.
Chahine Funds Equity Continental Europe
The fund is up +17.3% since the start of the year (Acc share class, in EUR), outperforming the MSCI Europe ex UK NR by +6.1%.

Past performance is not a reliable indicator of future performance. Source: IRIVEST IM, FactSet, Data as of 30/06/26. Share class Acc in EUR. Net of fees.
The fund outperformed its benchmark over the period thanks to its stock selection and the resulting favourable sector allocation, driven mainly by industrial stocks (electrical equipment, defence, construction) and, depending on market conditions, consumer discretionary and technology. Active risk management – involving the activation of one of the smoothing mechanisms, followed by a shift to a contracyclical strategy – helped to mitigate the impact of periods of high market volatility and gradually reduce exposure to the most cyclical segments, particularly small and mid-caps. This adjustment to the portfolio’s composition helped to preserve performance whilst maintaining a significant lead over the index.
Chahine Funds Equity Eurozone
The fund is up +20.6% year-to-date (Acc share class, in EUR), outperforming the MSCI EMU NR by +8.1%.

Past performance is not a reliable indicator of future performance. Source: IRIVEST IM, FactSet, Data as of 30/06/26. Share class Acc in EUR. Net of fees.
The fund outperformed its benchmark over the period, supported by positive stock selection, particularly in the IT and industrial sectors. The ‘all-cap’ positioning was a driver of performance in certain market environments, whilst it could act as a drag during rotations favouring large-caps. The transition to a contracyclical strategy helped to reduce exposure to small- and mid-caps, limiting their less favourable impact towards the end of the period. This active management enabled the fund to maintain a significant lead over the benchmark index.
Chahine Funds Equity Europe Smaller Companies
The fund is up +15.1% since the beginning of the year (Acc share class, in EUR), outperforming the MSCI Europe Small Cap NR by +9.7%.
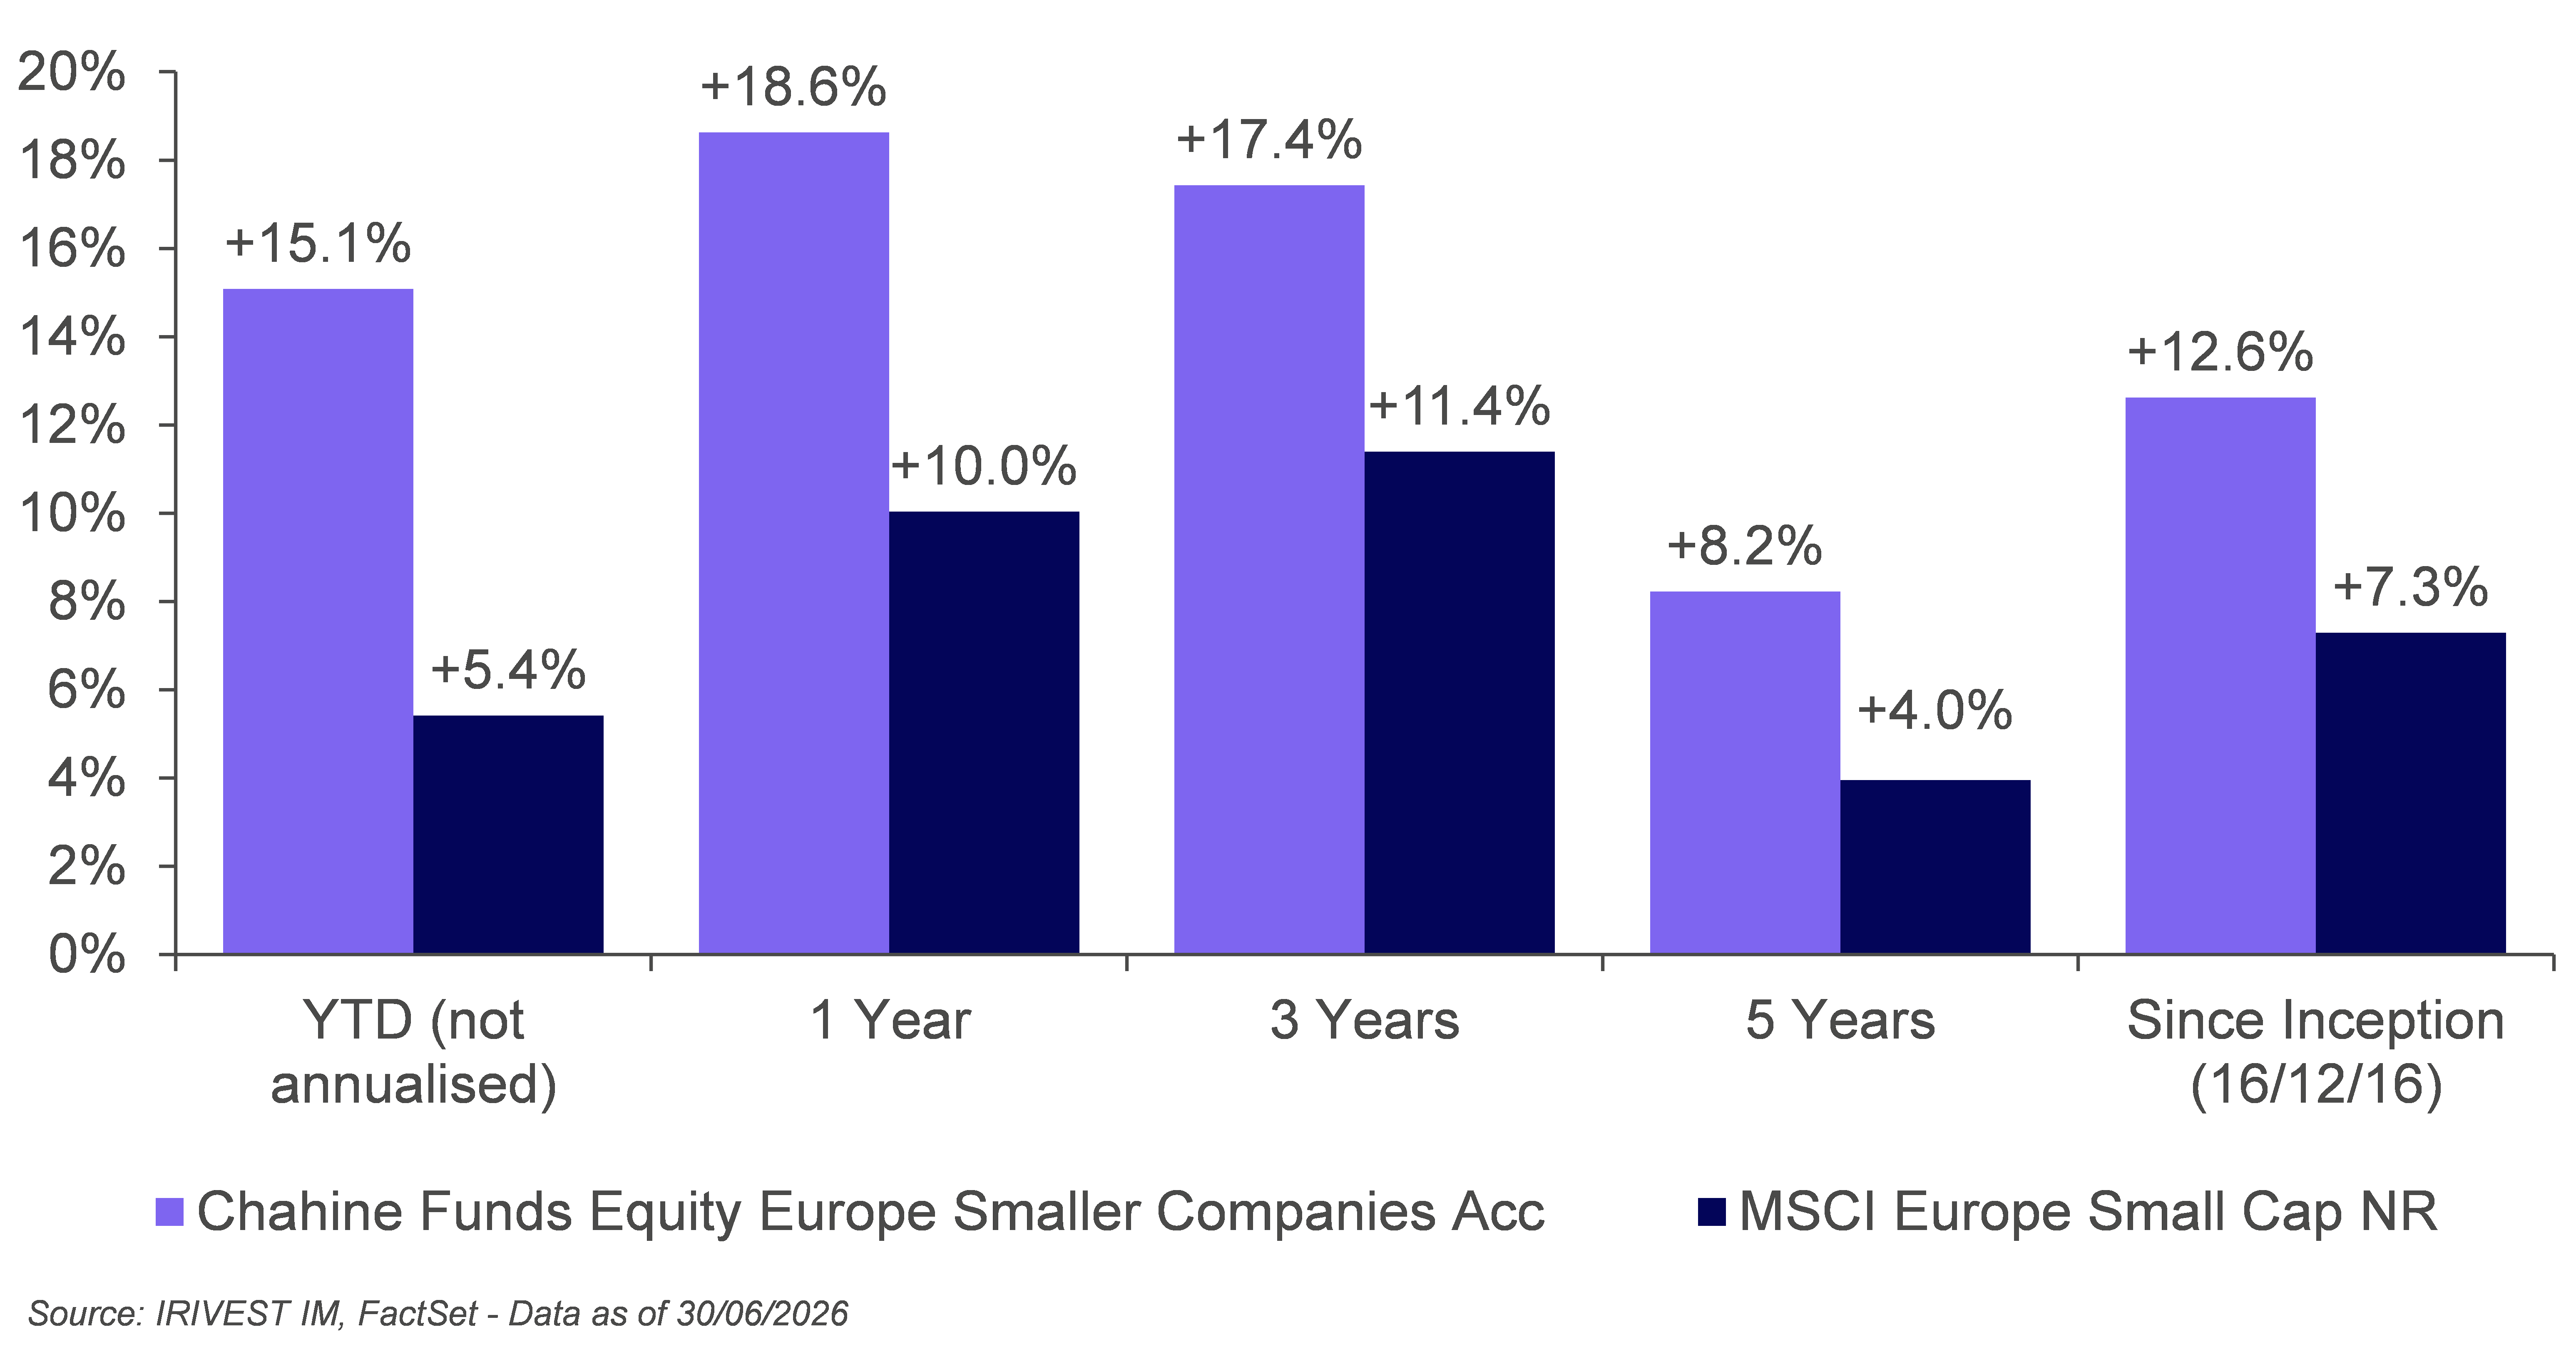
Past performance is not a reliable indicator of future performance. Source: IRIVEST IM, FactSet, Data as of 30/06/26. Share class Acc in EUR. Net of fees.
The fund significantly outperformed its benchmark thanks to a combination of sound stock selection and the resulting favourable sector allocation. The main drivers of performance were the IT, industrials and materials sectors and, depending on market phases, the financial sector. The fund’s energy sector demonstrated good market timing, but energy stock selection was relatively less favourable. The smoothing mechanism and the shift to a contracyclical portfolio construction limited the impact of periods of high market volatility by reducing active risk. This disciplined management, combined with positioning adapted to market developments, enabled the fund to maintain a significant lead over its benchmark index throughout the period.
Chahine Funds Equity US
The fund is up +56.1% year-to-date (Acc USD share class, in USD), vs. +9.9% for the MSCI USA NR and +22.6% for the MSCI USA Small Cap NR.

Past performance is not a reliable indicator of future performance. Source: IRIVEST IM, FactSet, Data as of 30/06/26. Share class Acc in USD. Net of fees.
The fund significantly outperformed its benchmark over the period, driven by a favourable exposure to the artificial intelligence theme. The fund’s exposure across all market capitalisations also provided significant support, particularly through small- and mid-cap stocks. Although the fund’s performance was dominated by the AI theme, the financial and industrial sectors also made positive contributions. By contrast, the energy sector was less favourable to the strategy. This successful stock selection within a highly promising theme explains why the fund significantly outperformed its benchmark, as well as all segments of the US equity market.
Convertible bonds: First semester 2026 Review and Outlook
The securities mentioned are provided for illustrative purposes only and do not constitute a recommendation to buy or sell.
The first half of 2026 confirmed the exceptional momentum of the convertible bond asset class. The global convertible universe, as measured by the Refinitiv Global Vanilla Convertible Bond Index (hedged EUR), returned +16.66% over the semester, making convertibles the best-performing global asset class, well ahead of global equities (+9.47% for the MSCI World in EUR), global investment grade credit (+0.55%) and global high yield (+1.87%). This remarkable result was achieved in a far from linear environment: the semester combined a strong start to the year, a sharp geopolitical and AI-driven correction in March, a historic rebound in April and May, and a consolidation in June as the Federal Reserve turned more hawkish.
Three main forces shaped the semester: the continued dominance of the Artificial Intelligence investment cycle, which now represents roughly one third of the convertible universe and drove an unusually concentrated share of returns; a record primary market that is structurally renewing the asset class; and a macro backdrop that oscillated between resilient growth and renewed inflation and geopolitical concerns.
In this environment, our Dynasty Global Convertibles fund delivered +6.22%, fully in line with its defensive mandate, capturing a meaningful share of the market upside with an equity sensitivity kept below 40% and lower volatility relative to the broader universe.
First semester review: a powerful but narrow and volatile rally
The year began on a strong footing. In January and February, convertibles extended the 2025 rally, outperforming equities, corporate credit and sovereign debt, with Japan and Europe leading regionally. Already at that stage, gains were narrowly driven by a handful of names linked to the AI investment cycle.
March brought the first real test of the year. The outbreak of the war in Iran and mounting questions over the sustainability of the AI trade triggered a sharp global correction. Asia and AI-linked stocks, once among the market’s strongest performers, were absorbing most of the de-risking pressure. Asia ex-Japan and emerging markets fell double digits, Iran-exposed Europe declined, while the US proved the most resilient region, helped by energy names benefiting from higher oil prices. Convertible bonds also suffered as valuations cheapened and credit spreads and rates backed up.
The recovery that followed was equally spectacular. April delivered a historic rebound and May extended the gains, as investors rewarded strong first-quarter earnings and continued AI capital expenditure while looking past the Middle East conflict, mounting inflation and higher bond yields.
June closed this first half of the year on a more cautious note. The hawkish June FOMC meeting pushed investors to price in higher-for-longer interest rates and to tame their AI expectations, cooling the rally by the end of the month. Equity weakness was most pronounced among Korean and U.S. chipmakers, though convertible holders were relatively spared, as sizable first-half redemptions from names such as SK Hynix and Seagate had effectively locked in most of their year-to-date gains for convertible bonds. Over the full semester, Japan and Europe were the best-performing regions, the US delivered strong gains, and Asia ex-Japan and emerging markets clearly lagged despite a positive absolute result.
One structural feature of the semester deserves emphasis: concentration. Globally, just a few names accounted for roughly half of the year-to-date gains. Concentration is thematic, centred on the AI trade, and makes the environment prone to larger swings in both directions. We believe that this context rewards discipline, selectivity and convexity.
Primary market: breaking records
The primary market was the structural story of the semester. Global issuance reached approximately $138 billion in the first half alone, with around $90 billion coming from the US. The pace is strong, 2026 is on track to exceed $200 billion for the full year.
The semester was marked by several milestone deals. February saw the $5 billion mandatory convertible from Oracle, and the largest convertible ever issued by a Japanese company, from Nippon Steel. March brought a $4 billion offering from AI infrastructure player Nebius. May recorded the largest US monthly volumes since early 2021, with a notable resurgence of healthcare and biotech issuance. Then to wrap-up the semester on a high note, June broke all records with $45 billion priced globally in a single month, with Alphabet's $19.3 billion mandatory convertible bond, the largest convertible deal on record and a signal that hyperscalers have embraced the asset class to fund their AI ambitions.
Beyond volumes, the market environment remained favourable for new issuance throughout the semester. The combination of a supportive equity market, tight credit spreads and well-supported equity volatility allowed companies to raise capital on attractive terms. This environment has encouraged borrowers to come back to the market opportunistically, refinancing existing debt, pushing out maturities and reducing interest expense while investor appetite for new paper remained strong.
Primary market: $138 bn in the first half of 2026

Source: BoFa Global Research, data as of 30/06/2026
Dynasty Global Convertibles: defensive discipline in a concentrated market
In this powerful but narrow and volatile market, the Dynasty Global Convertibles fund returned +6.22% net over the semester, a result fully consistent with its defensive strategy. The fund navigated the semester with an equity sensitivity at the upper end of its 20–40% target range, an average investment grade profile (BBB), around 55 holdings, an average credit spread of 140 basis points, and a meaningful allocation to short-dated convertibles and corporate bonds, providing carry and reinforcing the portfolio’s defensive profile.
This positioning delivered what it is designed to deliver: substantial participation in a strong equity market, capturing roughly two thirds of the MSCI World's return, with a contained maximum drawdown during the March correction.
Thematically, the fund's performance drivers closely mirrored its strategic convictions. The top contributors were dominated by the AI hardware and infrastructure complex: Western Digital, SK Hynix, Lumentum and MKS Instruments. This theme was by far the largest positive contributor to returns over the semester, complemented by AI software and cybersecurity through Cloudflare, Snowflake and Palo Alto Networks. The Energy Transition and Electrification theme also contributed meaningfully via Bloom Energy and Schneider Electric, while AST SpaceMobile added performance from the space connectivity theme. The geography of these winners, predominantly US names, proved as decisive as the theme itself.
On the negative side, detractors were concentrated in two areas. First, Asian and Chinese exposure: Alibaba, Ping An Insurance, Zijin Mining and Xiaomi suffered from the March de-risking of Asia and the underperformance of the region over the semester. Second, the Defense theme that consolidated after its exceptional 2025, with Rheinmetall and AeroVironment giving back part of their gains; we view this as a healthy pause in a structural rearmament story rather than a change in this structural theme.
The lesson of the semester is clear: in 2026 so far, the regional allocation, US over Asia, mattered as much as thematic selection, and within themes the AI hardware overwhelmed everything else.
Outlook for the second semester: constructive, but discipline required
The macro backdrop warrants more caution than our initial outlook for the year. The hawkish turn of the Federal Reserve in June and the prospect of higher-for-longer rates remove one of the supports we had identified for 2026, while persistent inflation, the Middle East conflict and stretched valuations in some pockets of the market constitute the main risks to monitor. Against this backdrop, technicals for the asset class remain powerful: record issuance that is now expected above $200 billion, demand for the asset class is broadening, and elevated single-stock volatility enhances the value of the optionality embedded in the asset class.
We remain constructive into H2 2026, though the scope for outsized gains has diminished following the recent run. Convertibles remain, in our view, the most compelling way to stay invested across the whole AI supply chain precisely because of their asymmetric profile: through the embedded equity option, they capture further upside if the AI cycle continues to power ahead, while their fixed income component may help mitigate part of a market decline, without guarantee.
Our positioning for the second semester remains faithful to our conviction-based, defensive approach: equity sensitivity managed within the 20–40% range, a credit quality bias, and selective exposure to our strategic themes — Artificial Intelligence, Energy Transition and Electrification, Defense modernization, and Materials.
Conclusion
The first semester of 2026 delivered an outstanding result for global convertible bonds, which outperformed all major asset classes on the back of the AI investment cycle and a record primary market. It has also reminded us, through the March correction and the June cooldown, that this rally is narrow, and exposed to geopolitical and monetary shocks. The Dynasty Global Convertibles fund did exactly what it is built to do: participate meaningfully in the upside while mitigating drawdowns. For the second half, we believe convertibles remain the smartest way to stay invested in the dominant themes of this cycle, and we will continue to favor discipline, credit quality and selectivity.
Macroeconomic outlook
H1 2026: An extraordinary first half
The first half of 2026 was extraordinary in many ways. First, it was extraordinary due to the intensity of the geopolitical “news flow,” with a succession of episodes of tension in the Middle East and Venezuela, not to mention the threats made by Donald Trump regarding Greenland and Cuba, and the conflict in Ukraine. Second, it was exceptional due to the markets’ ability to absorb these shocks without lasting disruption, despite a particularly turbulent political, energy, and monetary environment. Finally, it was exceptional due to the wide variation in performance observed at all levels: across regions, sectors, and investment styles, as well as across market capitalization segments.

Source Factset/IRIVEST IM as of 30/06/2026
Despite this turbulent environment, investors will likely look back on this period positively. The MSCI Europe NR rose +10.7% over the first six months of the year, while the MSCI USA NR gained +9.9% in USD. On both sides of the Atlantic, the technology sector led the sector rankings, with returns nearing +30% in both Europe and the United States, driven by the continued strength of the AI theme.
A Deteriorating Macroeconomic Environment in Europe
The situation in Iran naturally took center stage, both due to its immediate impact on energy prices and its repercussions on inflation expectations, long-term interest rates, and, ultimately, risk premiums. However, the fact that markets have generally weathered this series of events should not lead us to underestimate the fragility of certain underlying balances.
In Europe, this fragility gradually became more apparent during the second quarter. Our proprietary Economic Momentum indicator, in fact, shifted to a countercyclical phase in late April, bringing to an end the longest procyclical phase observed since the indicator’s creation in 2003.
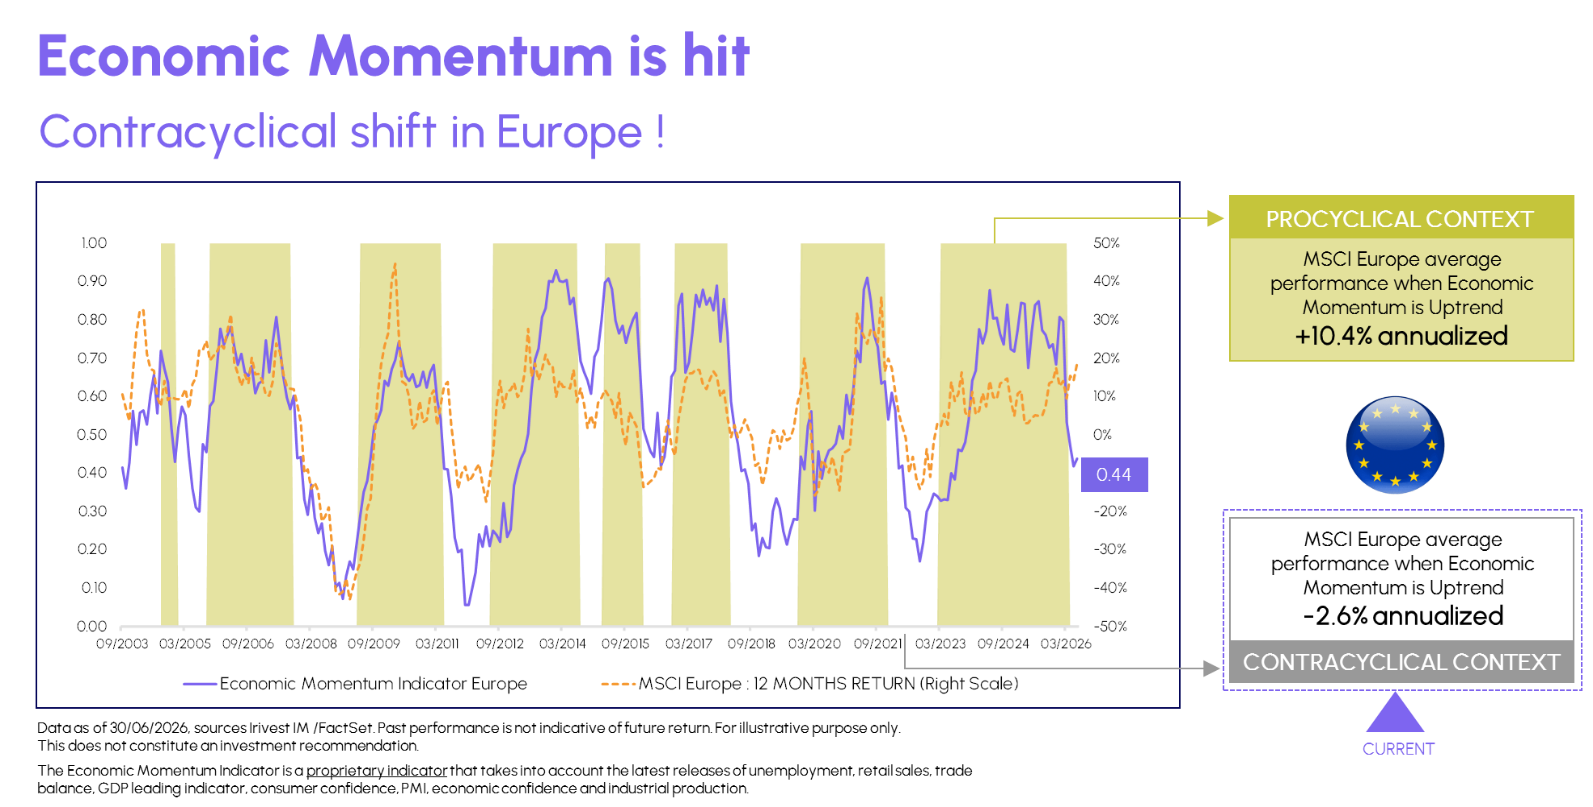
This shift occurred just as the ECB decided to raise its policy rates for the first time in nearly three years. The timing is certainly intriguing.
Such a shift does not necessarily imply a sharp reversal in the markets, but it suggests that the performance trend could become less directional, as illustrated by the historical analysis below. This is despite the recent easing of oil prices and the decline in inflation expectations following the U.S.-Iran memorandum of understanding, the strength of which remains, at this stage, relatively limited.

Toward a More Diversified and Less Cyclical Momentum?

In this context, certain defensive segments of the European market—which have lagged behind since 2020—could now benefit from a catch-up rally. Conversely, European small- and mid-cap stocks appear relatively more vulnerable, given their structurally procyclical bias, as highlighted by the historical analysis of cyclical sensitivities presented above.
The first signs of this rotation appeared in June, at the very end of the half-year: small-cap stocks underperformed significantly (MSCI Europe Small NR -3.0% versus MSCI Europe NR +3.0%), while the defensive “Visibility” style outperformed the other styles—a scenario not seen in nearly two years.
-
ABOUT IRIVEST INVESTMENT MANAGERS: www.irivest.com
IRIVEST Investment Managers is an independent Luxembourg-based investment management company. Since 1998, it has been a pioneer in quantitative momentum investment applied to European and US equity strategies through the “Chahine Funds” SICAV. The equity investment team develops algorithmic models to identify stocks that will outperform the market. Its expertise in convertible bond and credit investment with “DYNASTY SICAV” is characterized by non-benchmarked investment based on strong convictions and a bottom-up selection process. IRIVEST Investment Managers is a member of IRIS Finance International Group and is based in Luxembourg and Paris.
DISCLAIMER
It is the responsibility of the reader to assess and assume all risks associated with the use of the information contained in this document, including the risk of relying on the accuracy, completeness, security, or usefulness of such information. The content of this document is provided for information purposes only and should not be construed as financial or other advice, nor as an offer to sell or a solicitation of an offer to buy any securities in any jurisdiction where such offer or solicitation would be unlawful. Prospective investors should refer to the Prospectus and Key Information Documents (KIDs) before making any final investment decision. Any information contained in this document is subject to change without notice. The views and opinions expressed herein reflect the analysis of IRIVEST IM as of the date of publication and may change without prior notice. IRIVEST Investment Managers and/or one or more of its employees, officers, or contributors may hold positions in one or more of the securities mentioned in this document.
d’investissement
actualités et perspectives
Continuer la lecture








.png)